GUI-HDMR Software
The GUI-HDMR software was developed to combine existing RS-HDMR tools and developed RS-HDMR extensions and to make them easily available for all interested users. The software is written in Matlab and requires the basic Matlab package.
The software comes with a graphical user interface (GUI), but can also be used without the GUI as a script based approach. In both cases the user has to supply only two files. The first one contains the rescaled input values which were used to perform the model evaluations and the second one contains the corresponding output values. Both files have to be provided as ASCII files within a matrix format.
The set of input values can be any Monte Carlo sample (if the input parameters can be controlled) or measured values (if using experimental data). If the input parameters can be controlled, then a quasi-random sampling method such as the Sobol' sequence is preferable. This guarantees that the input space is covered more uniformly than by using random values and it provides a better convergence rate.
A fully functional metamodel is constructed using only the one set of samples provided. Additionally, first and second order variance based sensitivity indices can be calculated.
Screen shots
Some screen shots of the GUI-HDMR software version 1.1 are presented here. For more information please refer to the user documentation.
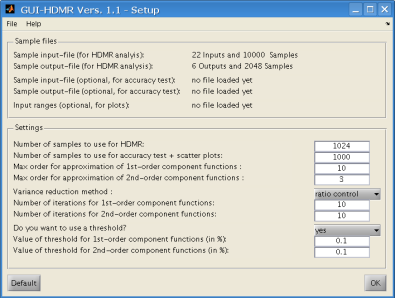
Setup Window
In the Setup window, the sample input and output files can be loaded and different settings for the HDMR analysis can be applied.
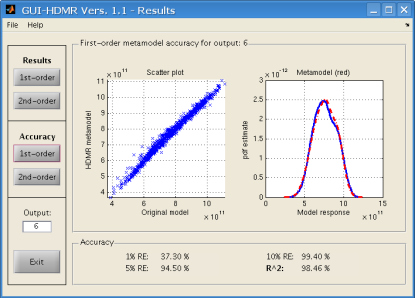
Results Window
The results window shows the accuracy of the HDMR metamodel in terms of the relative error and coefficient of determination. A scatter plot (original model versus HDMR metamodel) and the probability density function estimate are also presented.
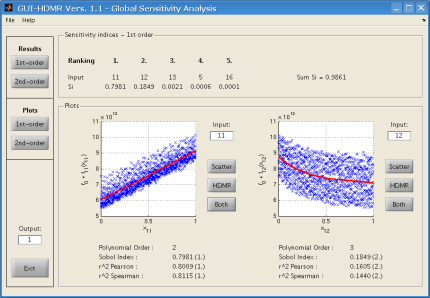
Sensitivity Analysis Window - First Order
The five most important first order sensitivity indices are shown. All first order component functions can be plotted and compared with scatter plots.
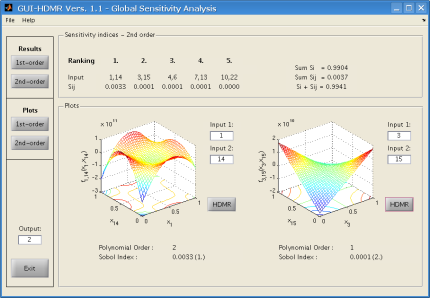
Sensitivity Analysis Window - Second Order
The five most important second order sensitivity indices are shown. All second order component functions can be plotted.